See FabIS Pulse on
real shop data
Watch a short walkthrough of the screens, or book a live demo and we’ll walk you through it. Below, we step through every dashboard — what you're looking at, and the one question each one answers.
Every part of your shop,
on its own screen
A handful of focused dashboards, each answering the questions you actually ask.
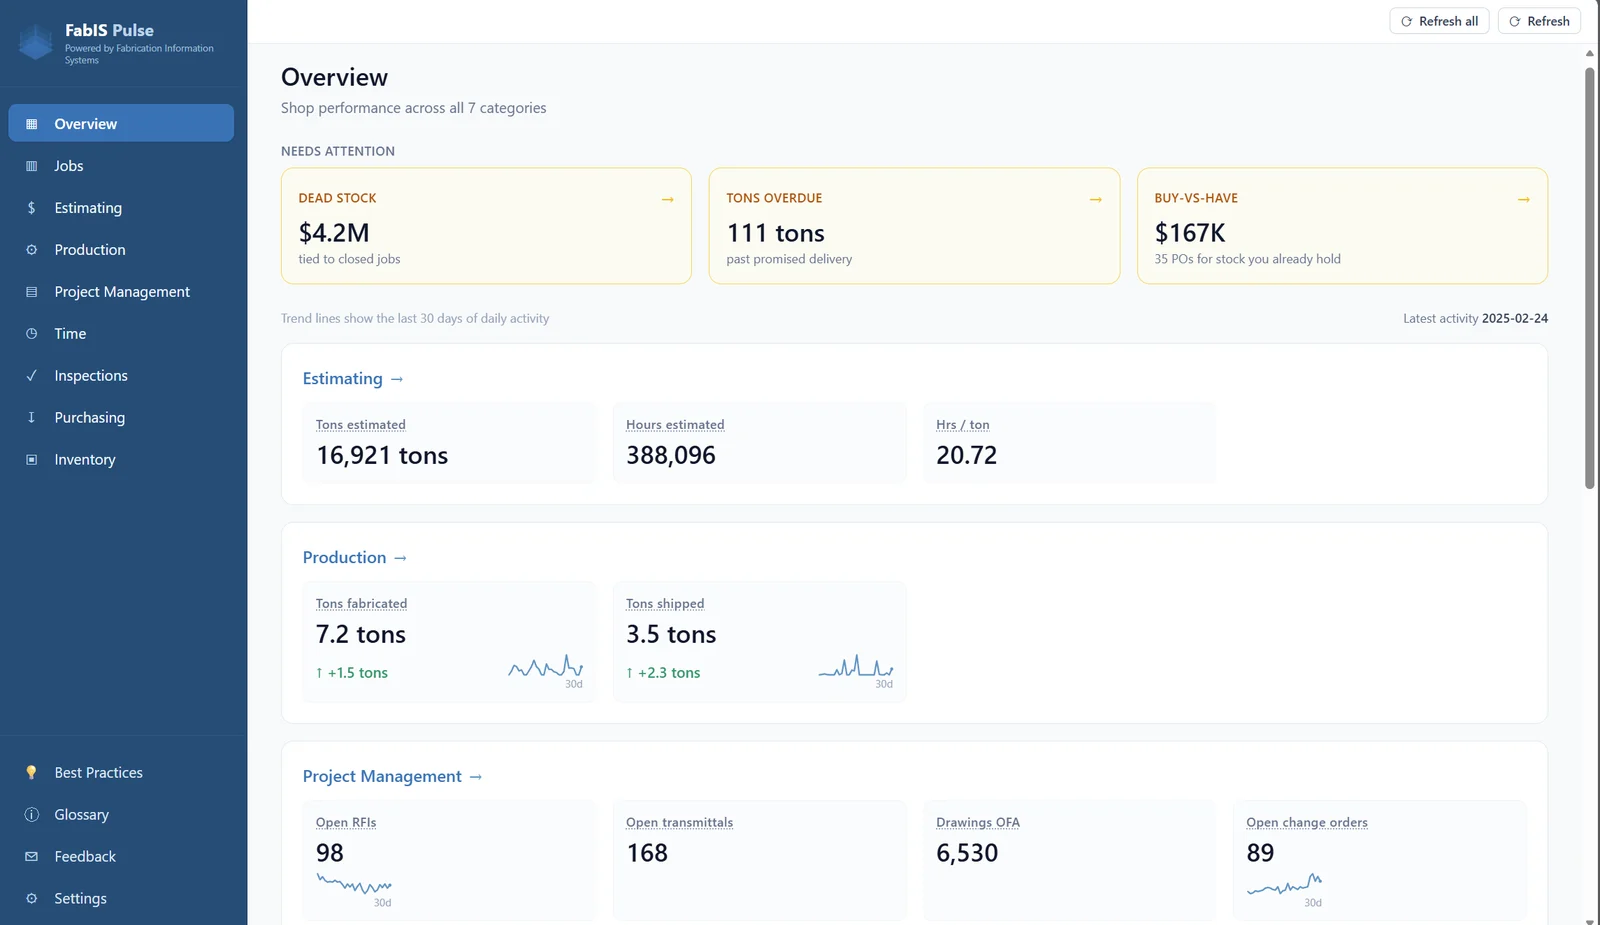
Overview
The health of your shop and every active project on one screen — job counts, schedule health, and what's shipping this week.
Is my shop on track today?
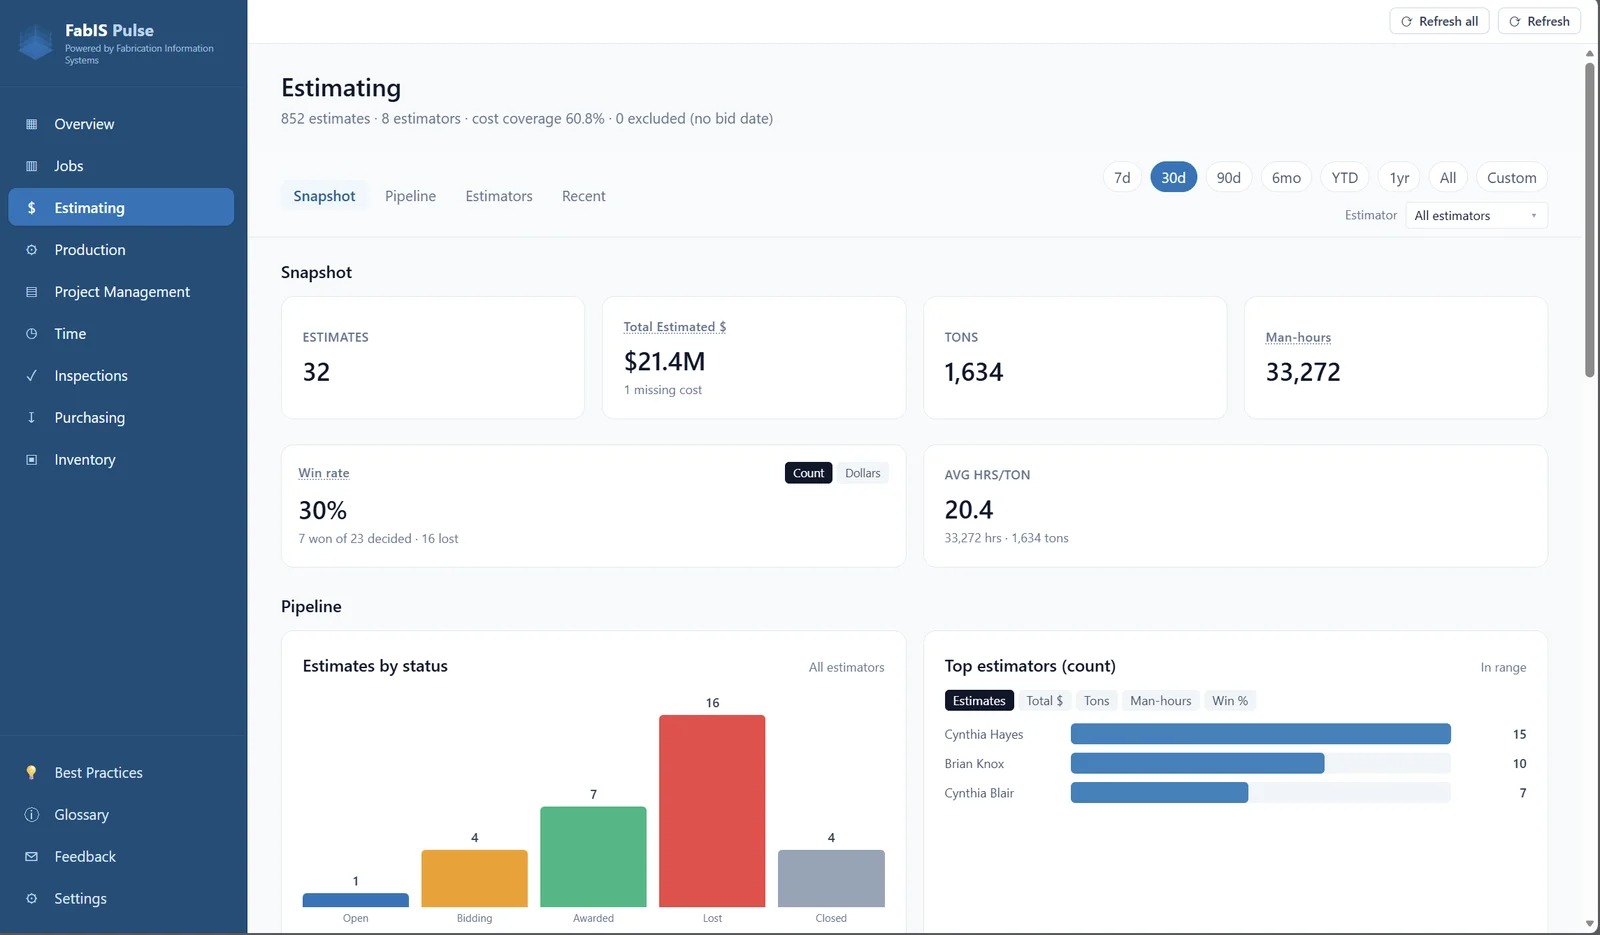
Estimating
Win rate, pipeline, and where your bids stand — everything shops usually keep in an estimating spreadsheet, pulled together so you can see what's landed, what's open, and what's slipping away.
How's our bid pipeline looking?
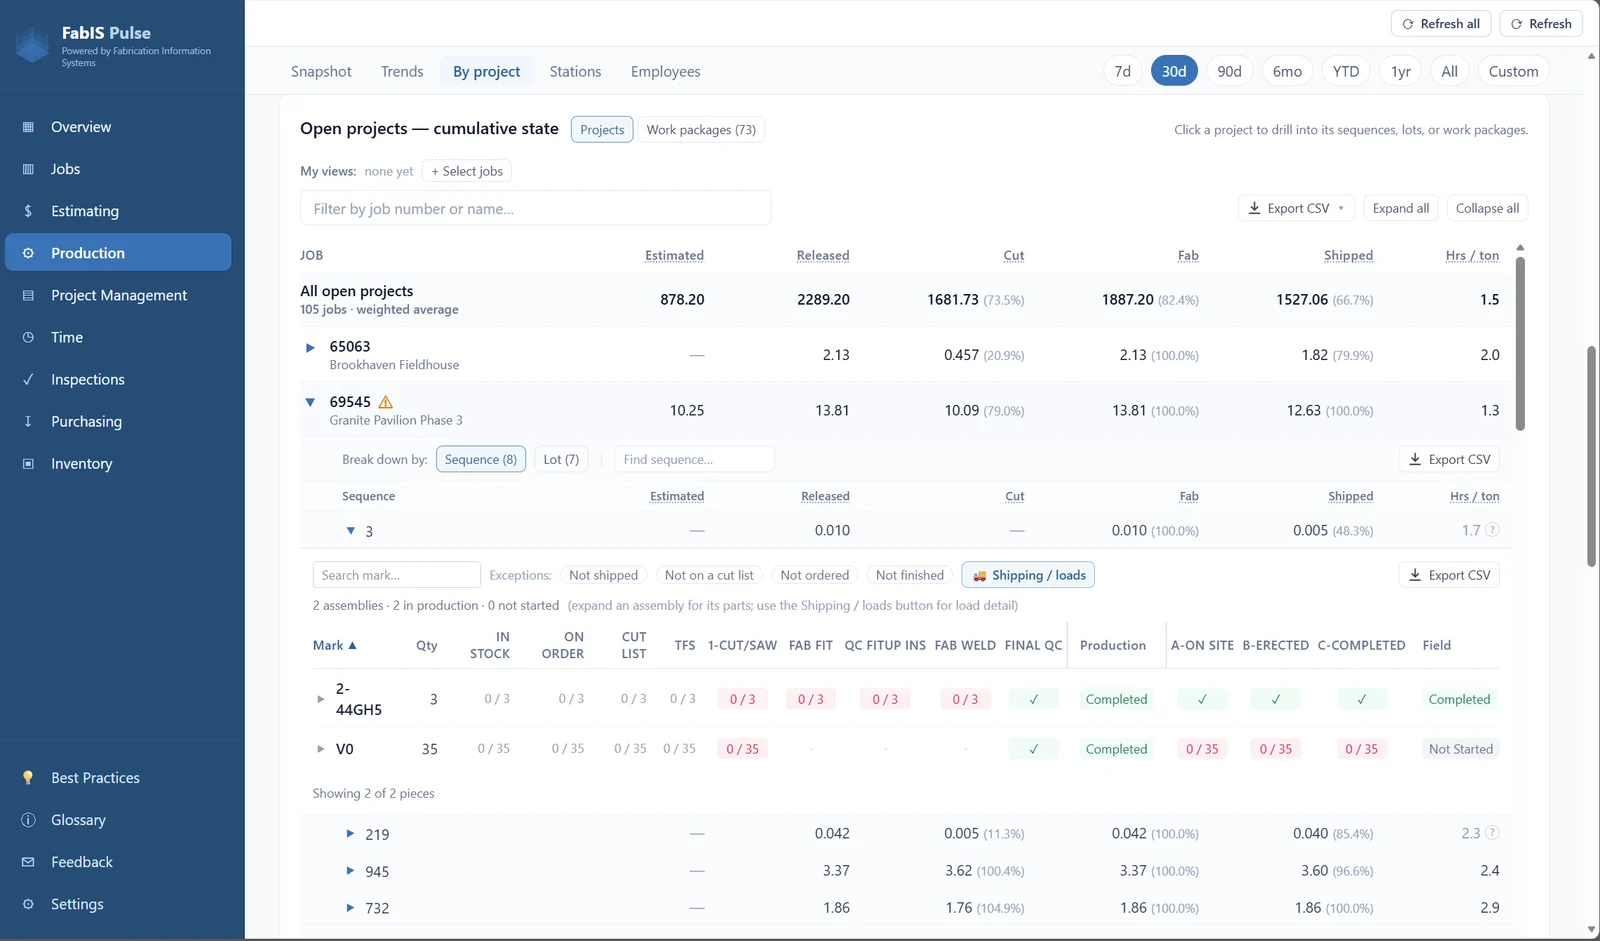
Production
What's moving, what's stuck, and throughput by station — the shop floor at a glance, so a bottleneck can't hide.
Where's the bottleneck right now?
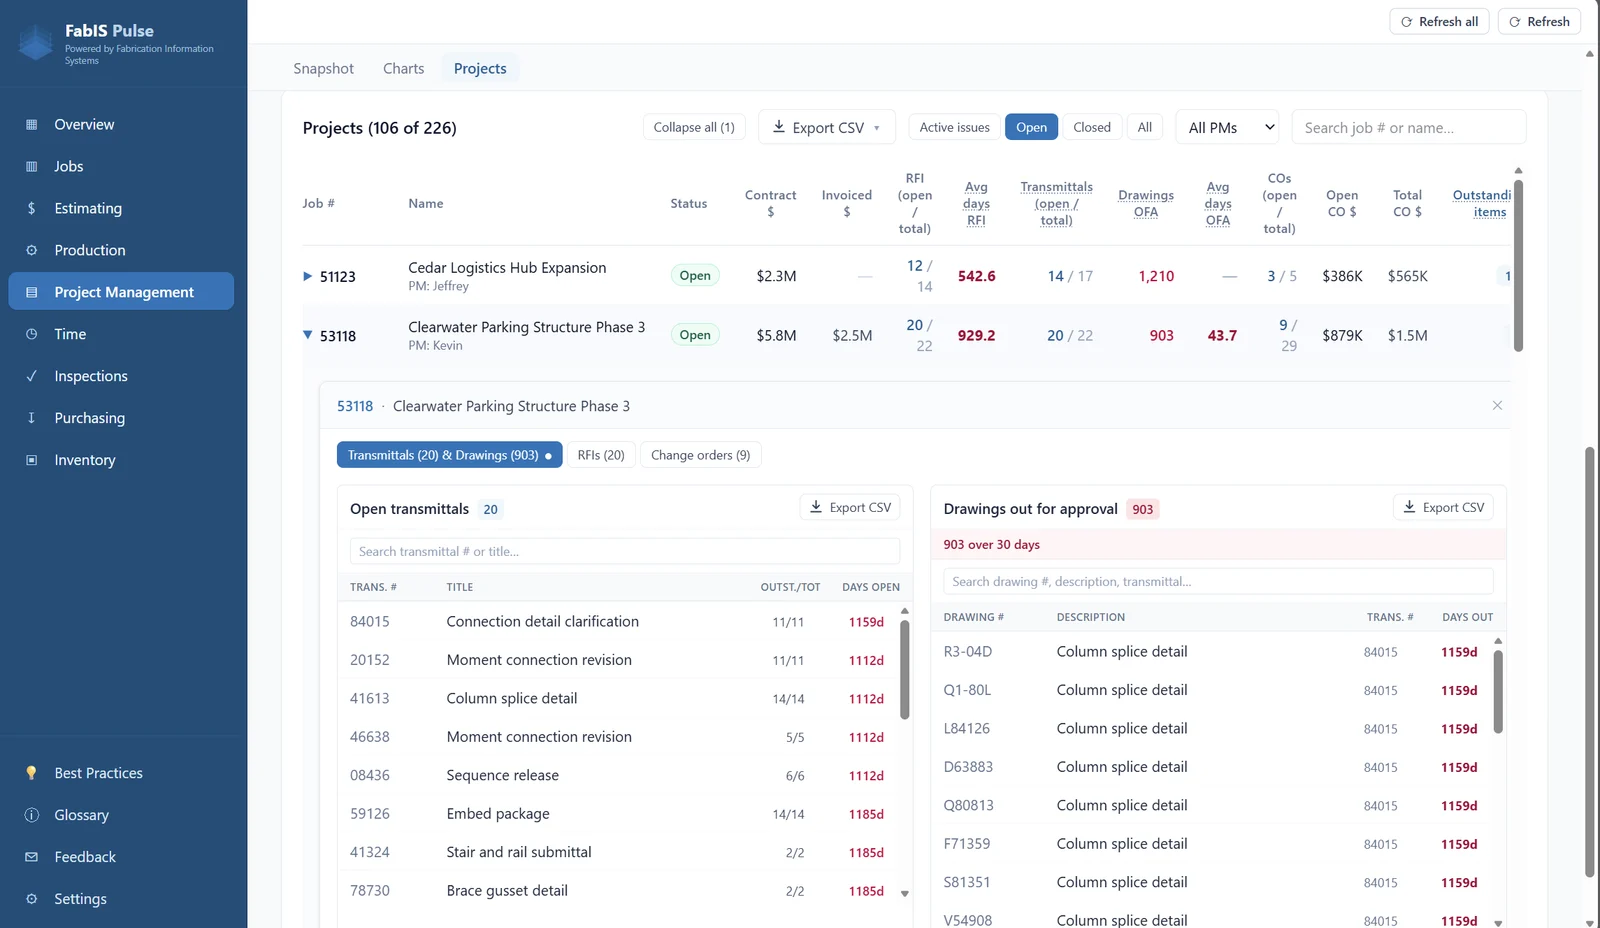
Project Management
Drawings back from approval, RFIs, and change orders across every job — the approvals that quietly hold up production, in one table so a project can't surprise you.
Which jobs need my attention?
Purchasing
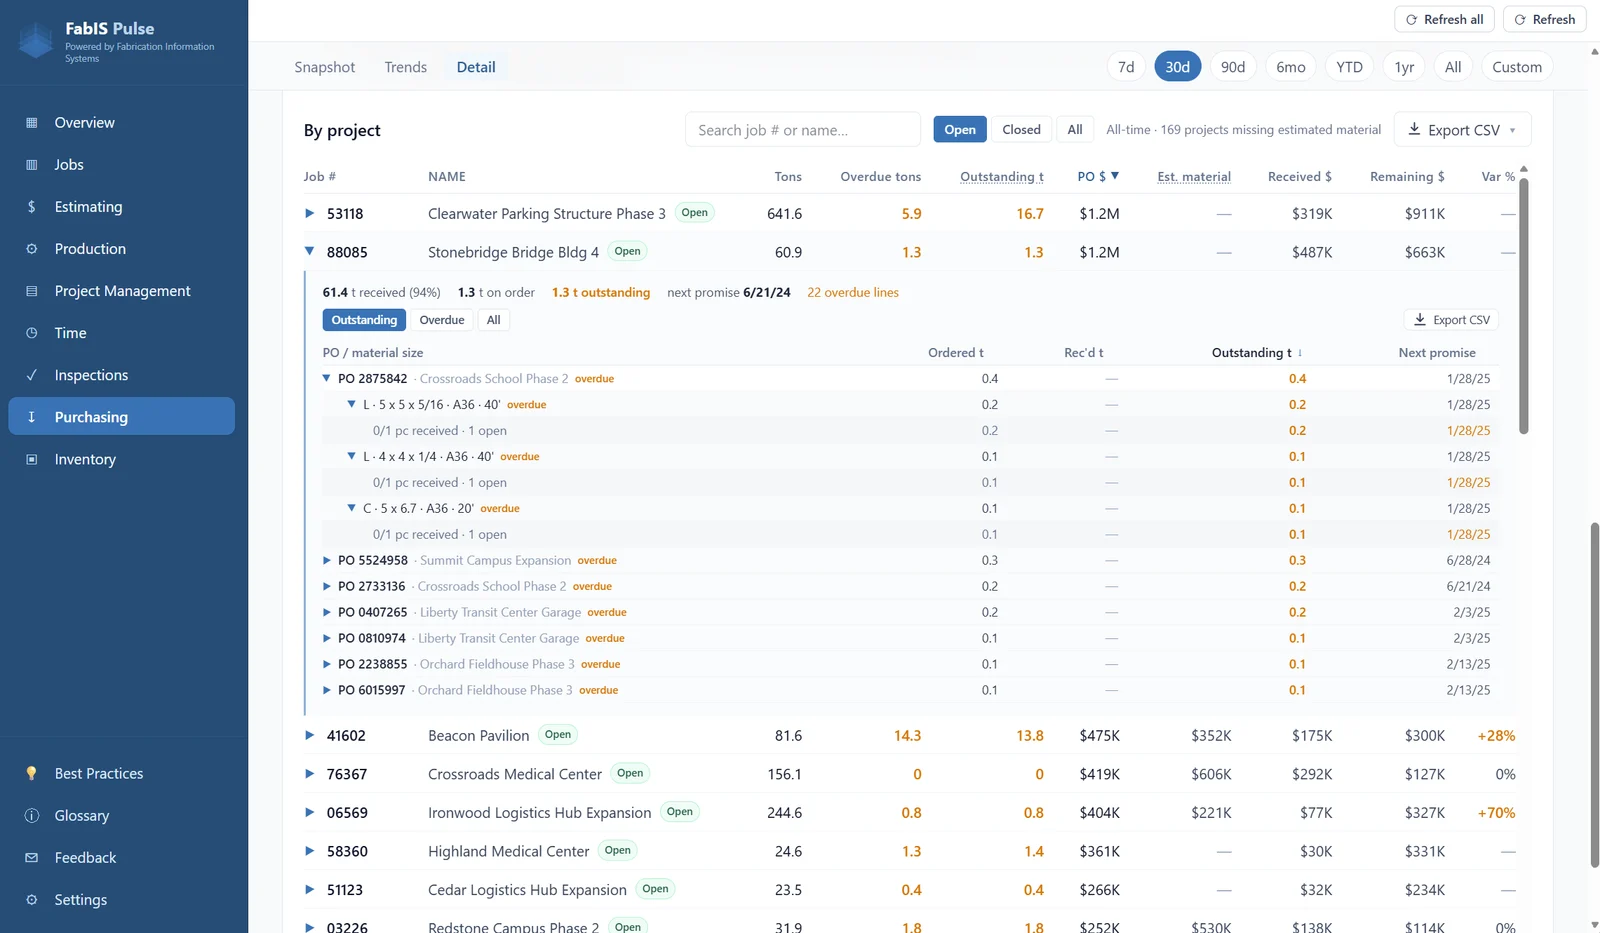
Estimated vs actual material, overdue deliveries, and outstanding POs by project — so a cost overrun or a late delivery shows up before it hits the floor.
Do we already have this material?
Inventory
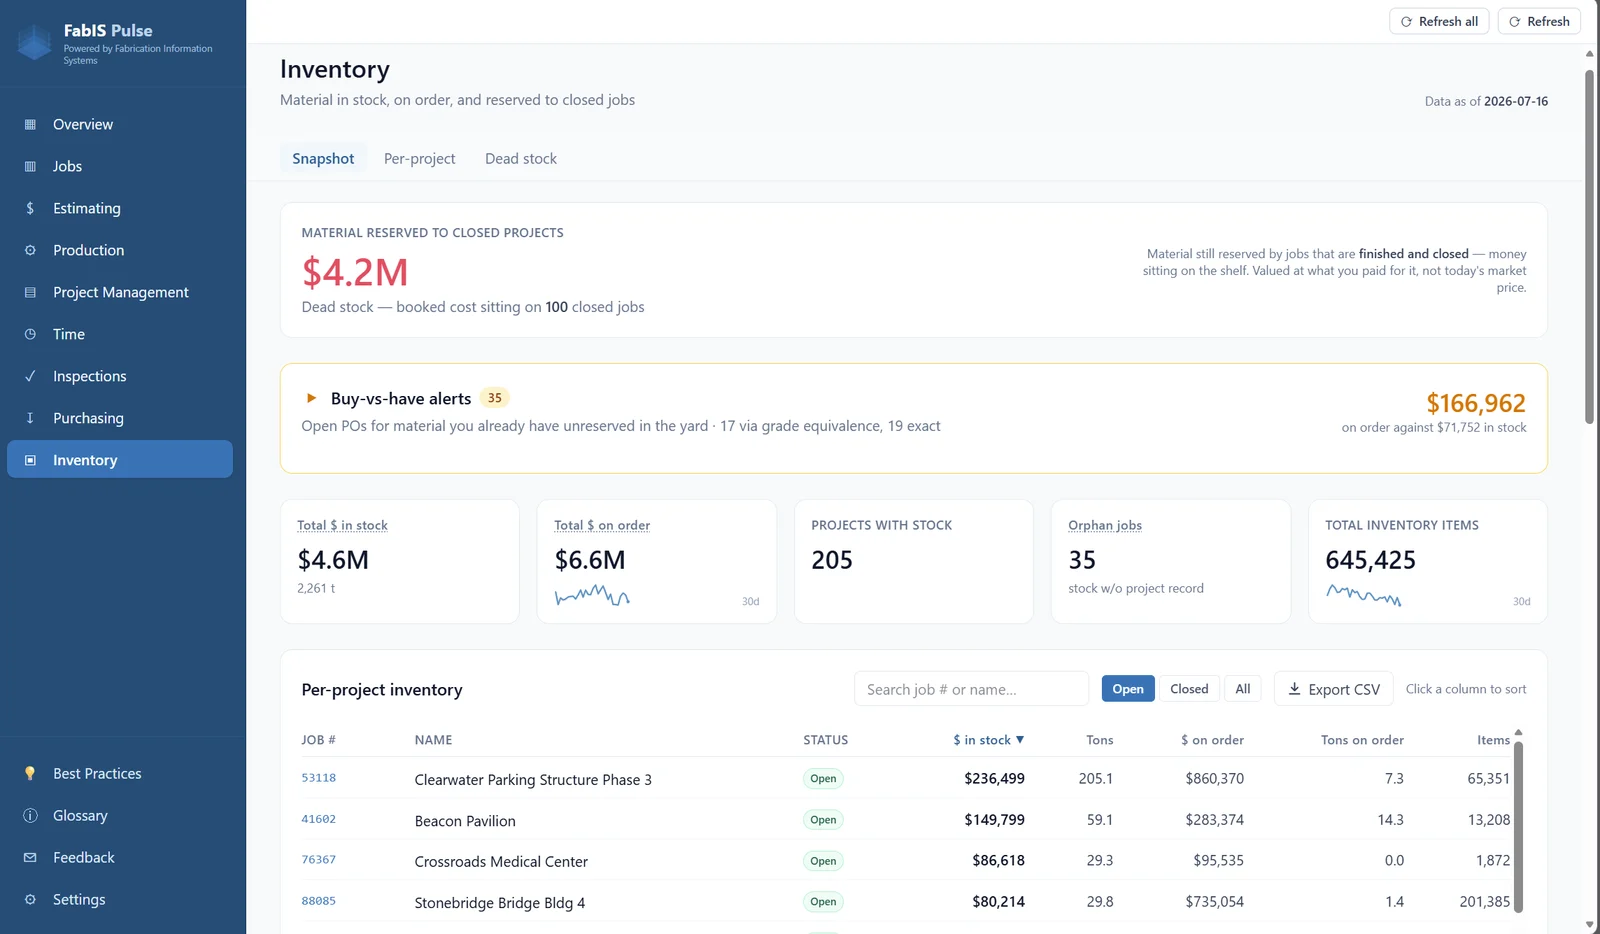
In stock and on order by project, plus dead stock — material still reserved for jobs that closed long ago, so you can free it back up.
What can I free back up?
Inspections
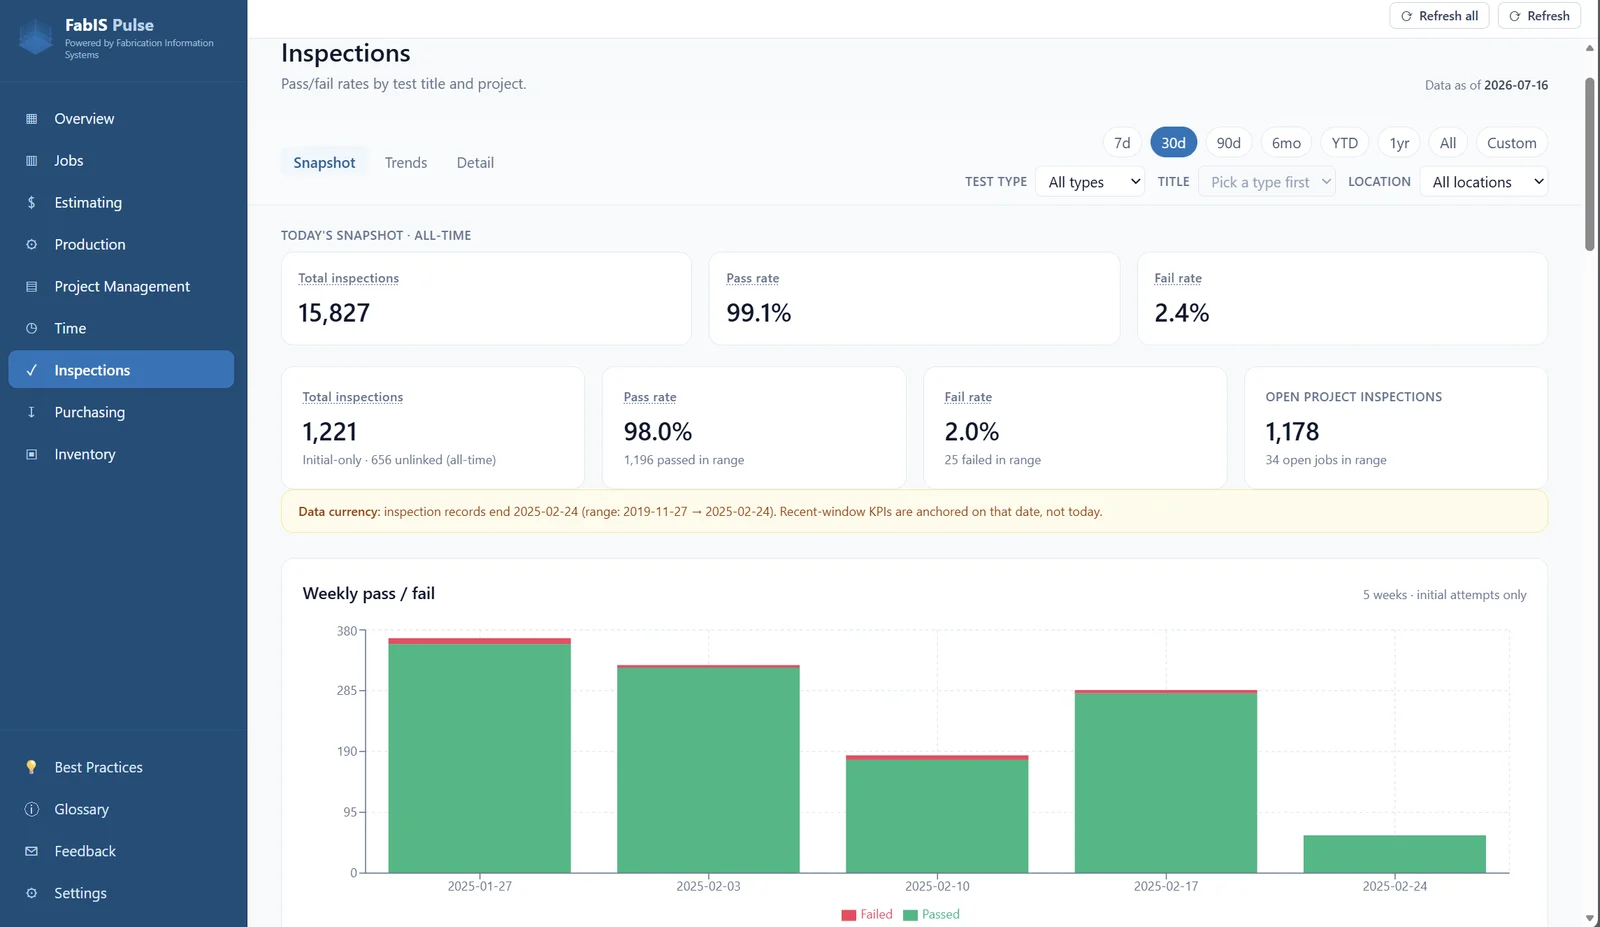
Pass/fail rate, the inspection queue, and inspections by project — numbers PowerFab won't give you, so a failed weld or missing sign-off never becomes a surprise at the dock.
What's holding up the truck?
Time
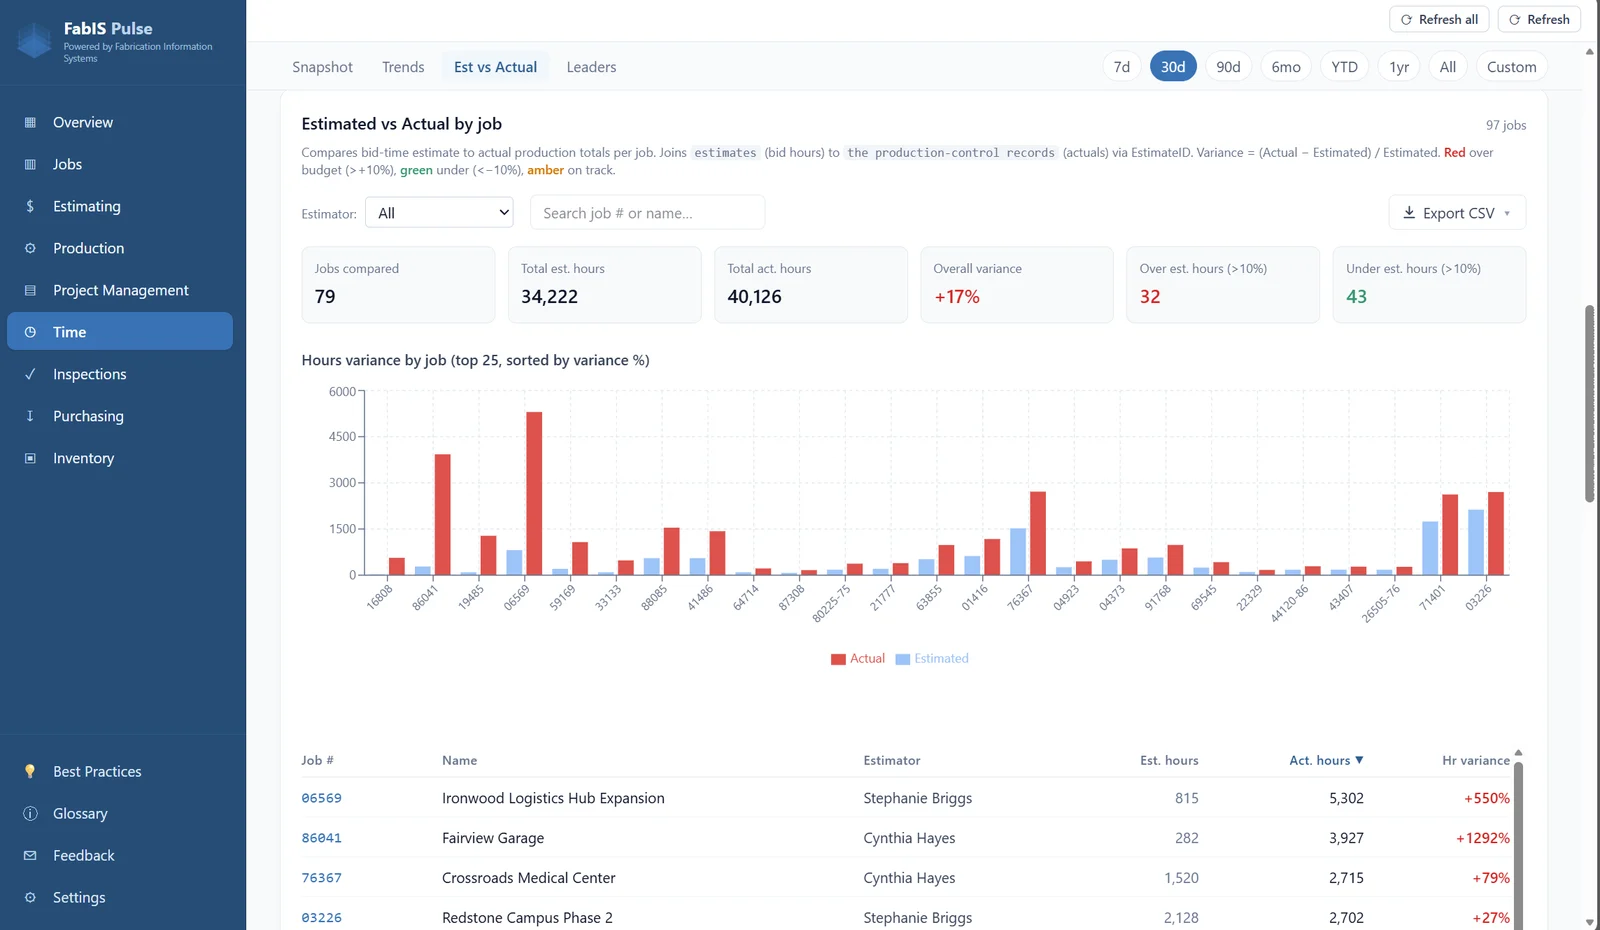
Hours by job and where the labor is really going — estimated against actual, so you know which jobs are eating your shop hours.
Where are the hours going?
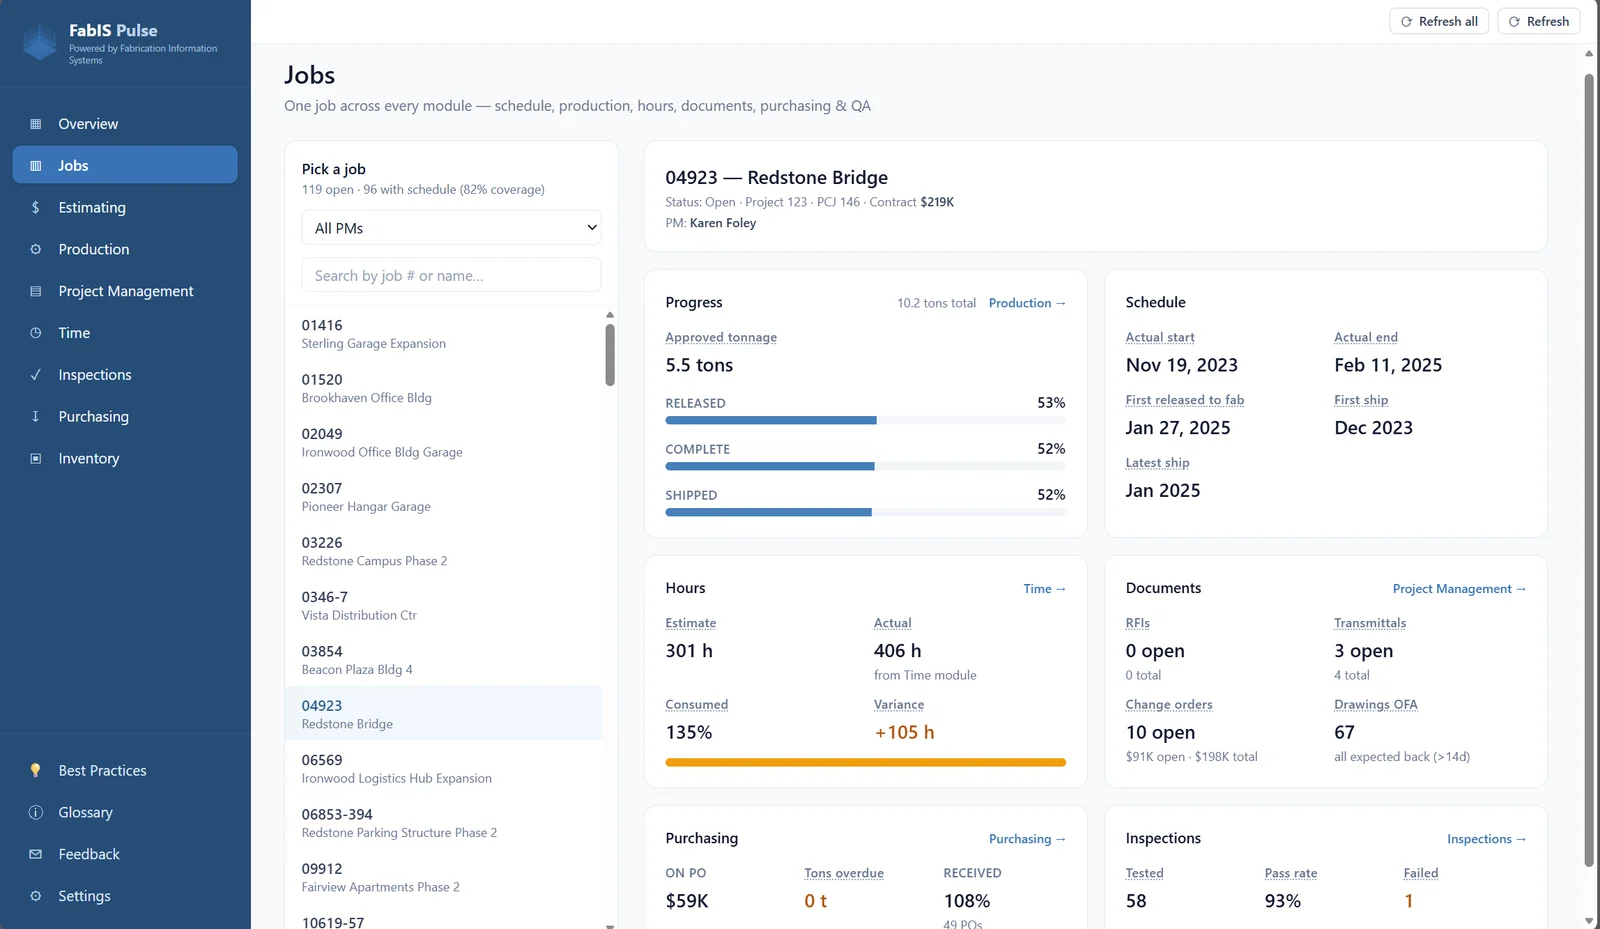
Jobs
One job, every module on a single screen — schedule, production, hours, documents, purchasing, and QA. Pick any job and see exactly where it stands, without hopping between reports.
Where does this one job stand?
Ready to see your shop
at a glance?
Book a demo and we'll walk you through FabIS Pulse live — every screen, start to finish.